Similarity Report 2019 Addendum
by
Chris Whittington
Ed Schröder
The first part of the Similarity Report 2019 compared first/best move choice of over a hundred chess engines, set to compute a best move at d=1, and return the result. Each engine returned a best move for 8000+ epd test positions, selected for the purpose of “move similarity between engines” testing, by Don Dailey, for the Simex Similarity tester in around 2011. Similarity between an engine pair is expressed as a percentage by count of same moves selected divided by total positions in the test suite.
To verify the Simex results, we tested again, increasing the number of test positions by a factor of around 20 (160,000 epds against 8000+ epds), and, because we don’t know for sure the epd selection method used by Don Dailey (if has been suggested he chose positions from computer chess games where evaluation was between plus/minus one pawn), we used, for the larger testing, an epd selection method based on the following:
- sampling was from a fully shuffled 1,000,000,000 suite of epds, originally created in 2018 for neural network training, containing positions from both human and computer games.
- the 1000 most commonly naturally occurring piece configurations were computed from this set.
- batches of 20,000,000 samples with roughly equal piece configurations of the 1000 most common were sampled into four groups based on game phase (opening to endgame).
- at this point we have 4 x 20,000,000 sets of epds.
- each set is shuffled, and 40,000 positions taken, in batches of 10,000.
- we now have 16 epd suites, each of 10,000 positions, organised by four game phases.
- each selected EPD was tested for count of legal moves available. Fewer than 0.3 of one percent of the selected EPDs had only one legal move.
We posit that our sampling method random samples from naturally occurring chess positions across a balanced range of material configurations and this represents a suitably representative wide-ranging sample of chess positions.
Verification testing
Each engine was tested again, set to search at depth=1, against each of the 16 x 10000 test suites. Note that in this testing we compute move similarity for each of four game stages, opening, early middlegame, late middle game and ending.
_____________________________________________________________________________________
Significant results
Click on the picture(s) to enlarge
Similarity Crafty-Fruit-Strelka
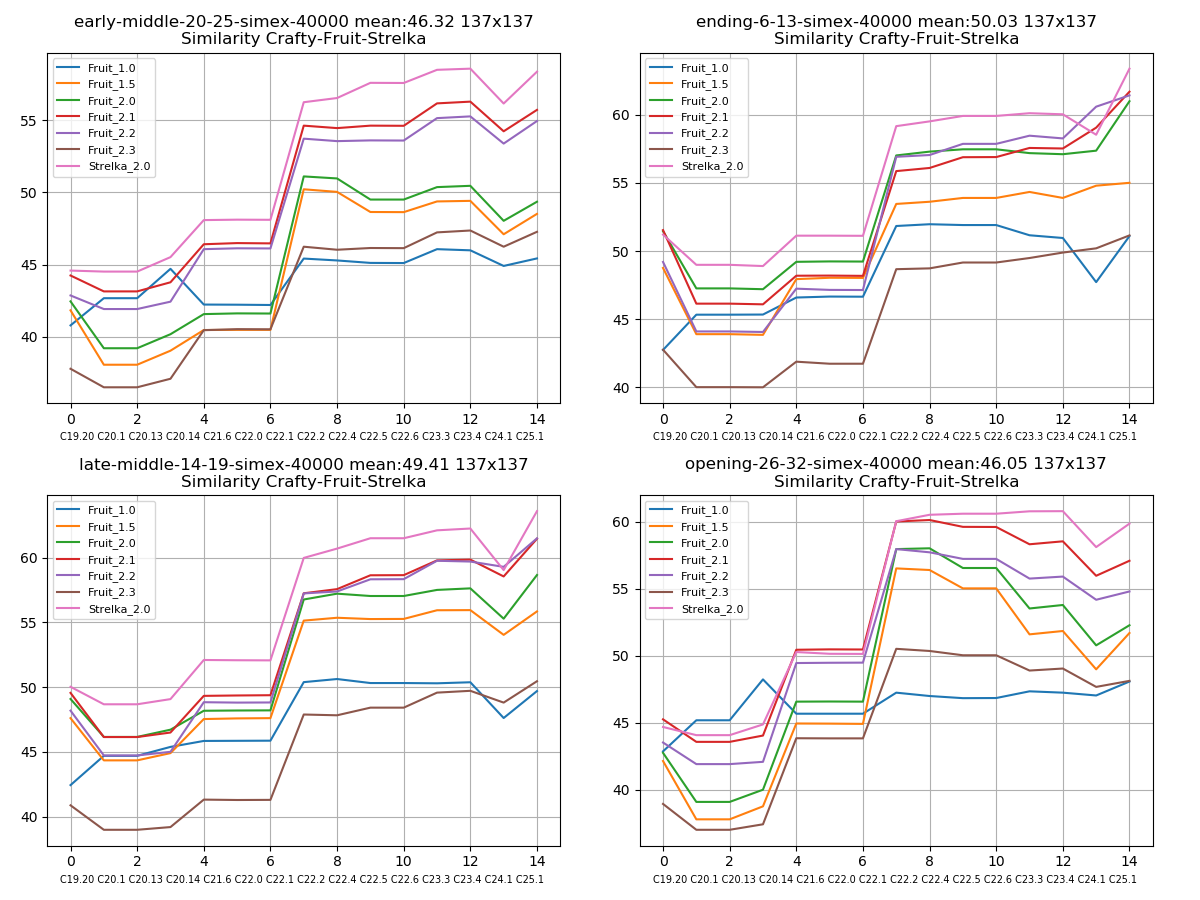
Figure 1.
Similarity-by-move-choice results, 40,000 epds each, four game stages, for six Fruit engines, Fruit 1.0 to Fruit 2.3 and Strelka 2 plotted against available engines in the Crafty development series Crafty 19.20 to Crafty 25.1
In each game phase the plots for all the Fruit versions and Strelka show a rising similarity across the Crafty development timeline.
Of particular significance is the relatively large jump at the points Crafty 22.1 to Crafty 22.2. The engine consistently showing the highest similarity with Craftys is Strelka_2.0 (coloured mauve in the plot), closely followed by Fruit_2.1 and Fruit_2.2 (red and light-blue). We also note the maintenance of the level of similarity, and the maintenance of relative
position of the Fruit engine lines. We posit this last feature suggests stability and lack of noise in the results (noise reduced by large numbers of positions tested). Crafty 24.1 appeared to regress a little, but then showed increased similarities with all Fruit and Strelka versions at Crafty 25.1
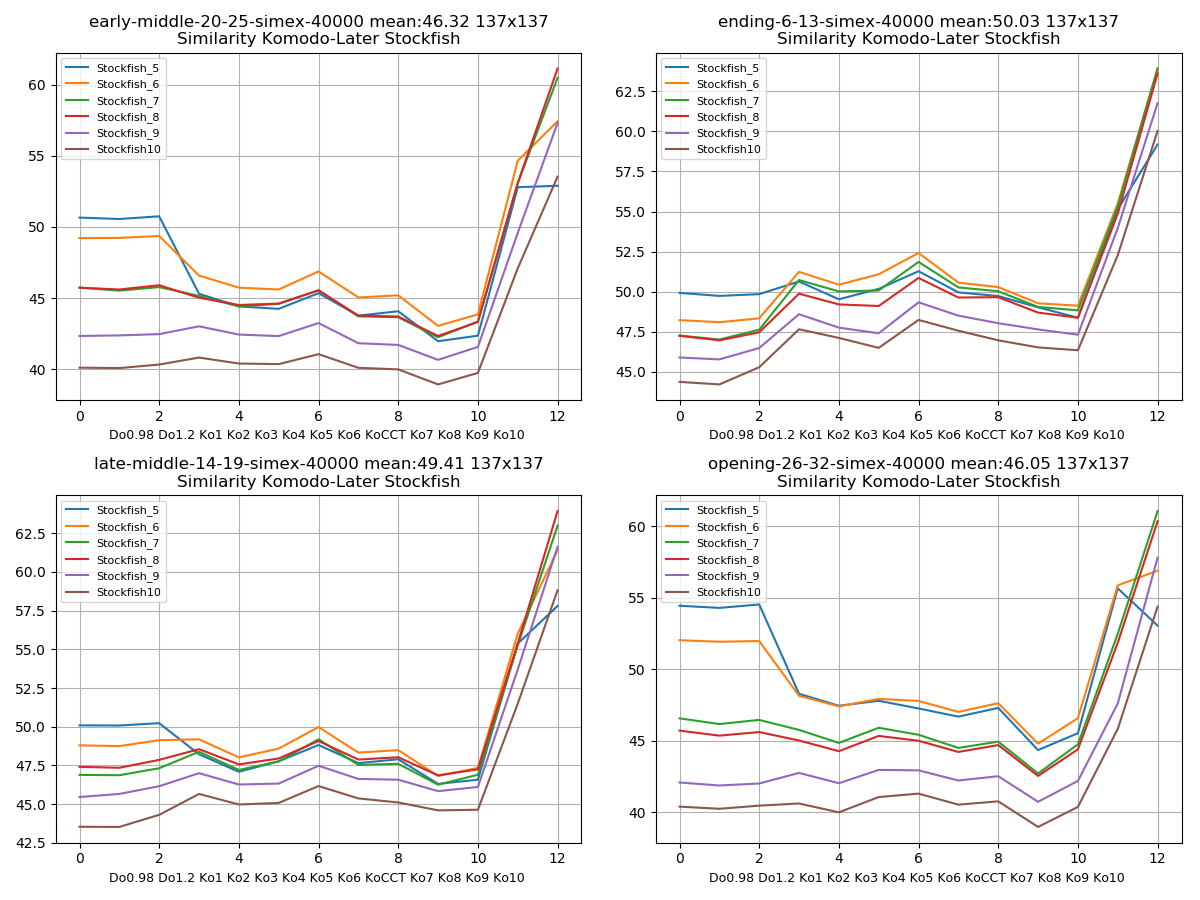
Similarity Komodo-Stockfish
Similarity Shredder-Fire-Stockfish
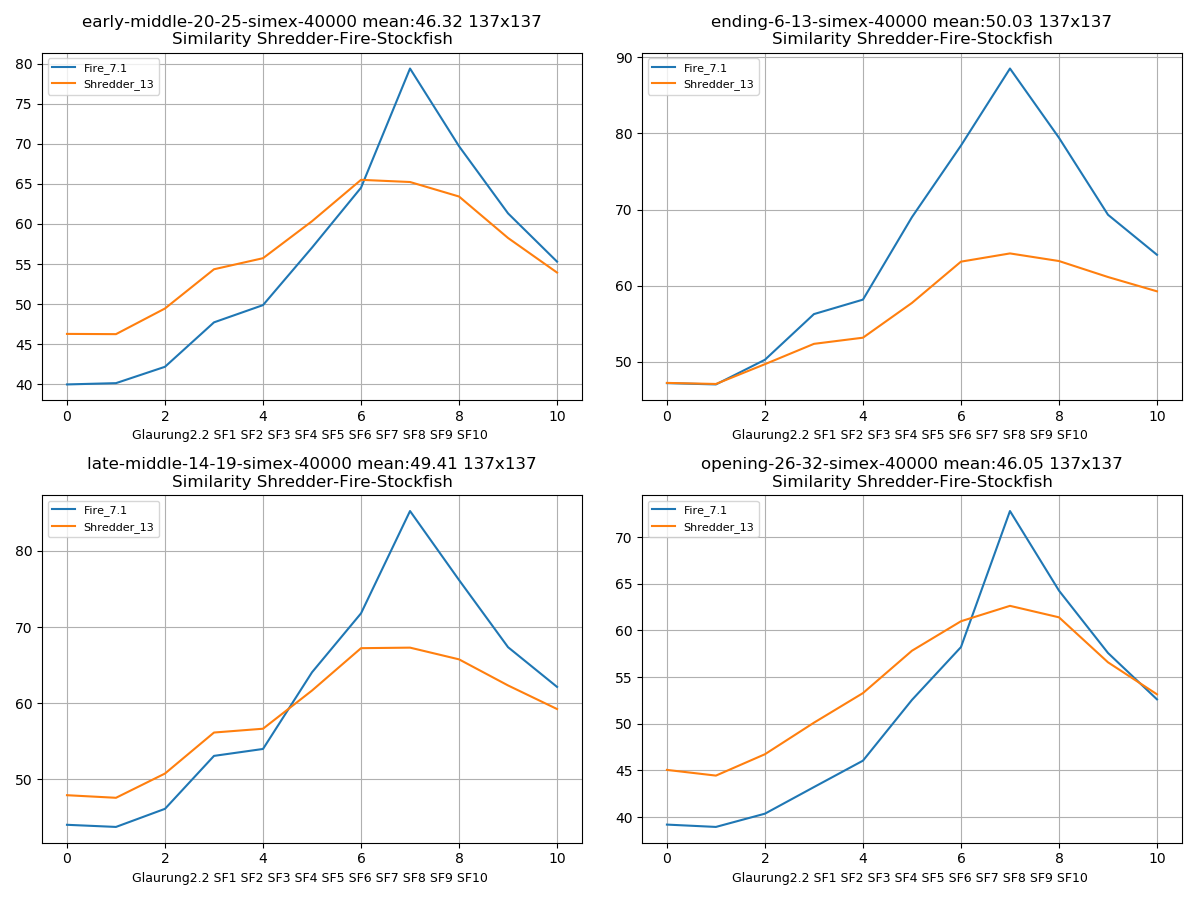
Figure 2.
Similarity-by-move-choice results for six Stockfish engines, SF 5 to SF 10, plotted against available engines in the Komodo series, from Doch 0.98 through Komodo 1 to Komodo 10.
Perhaps the striking feature of these plots is the gradual move away from any Similarity with Stockfish from the very early Komodo engines (including Doch) until the leap in Similarity shown across all game stages at Komodo 9 and Komodo 10, typically 15 points.
Figure 3. Similarity-by-move-choice results for Fire 7.1 and Shredder 13 plotted against Stockfish engines from Glauring 2.2 through Stockfish 1 to Stockfish 10.
Here Shredder 13 shows a gradual rise across all game phases towards a peak around Stockfish_6 or Stockfish 7.
Fire 7.1 shows Similarity by move choice of over 70 to close to 90 percent with Stockfish 7.
_____________________________________________________________________________________________
4 Illustrative individual plots
10,000 epds
four game stages
for Crafty-Fruit-Strelka
showing also a histogram of move width and a histogram of move similarity for the 137 engine-pairs tested.

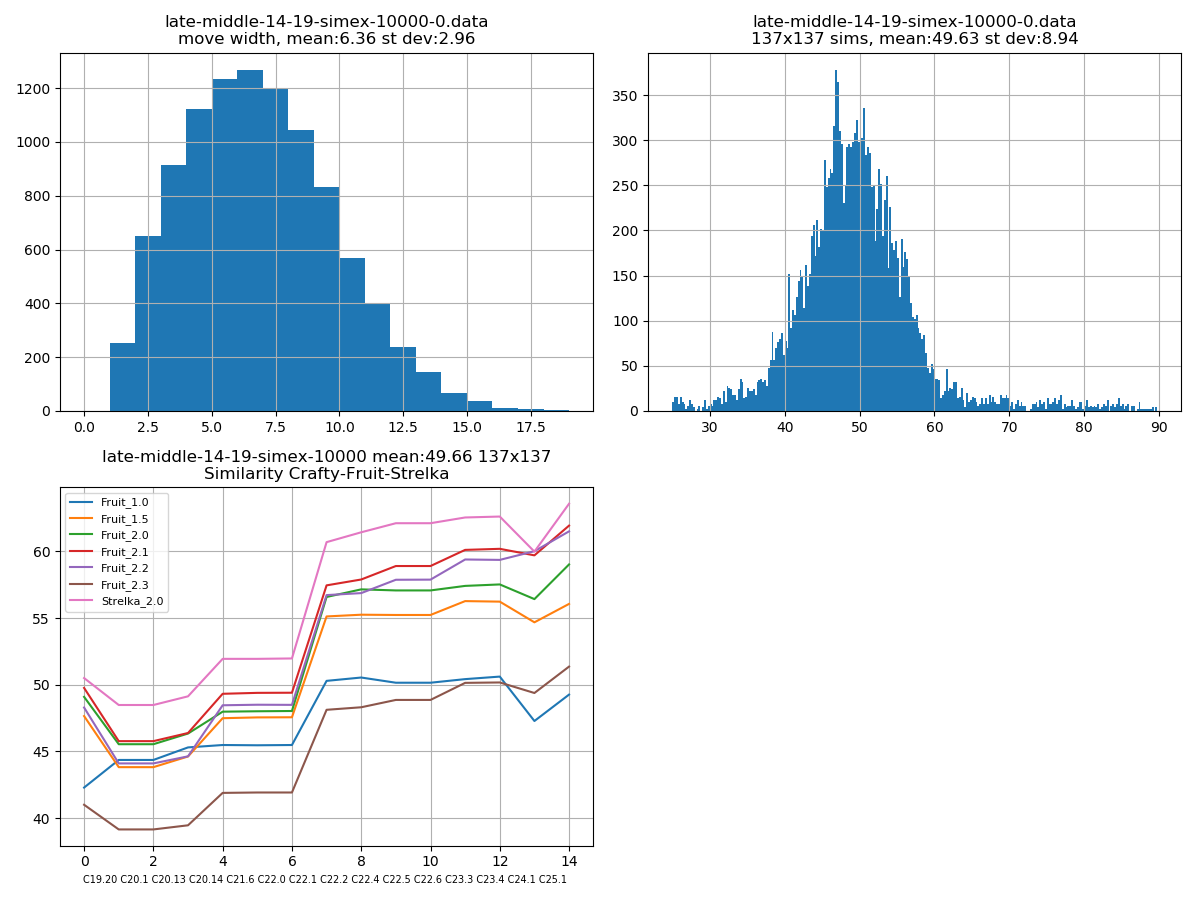
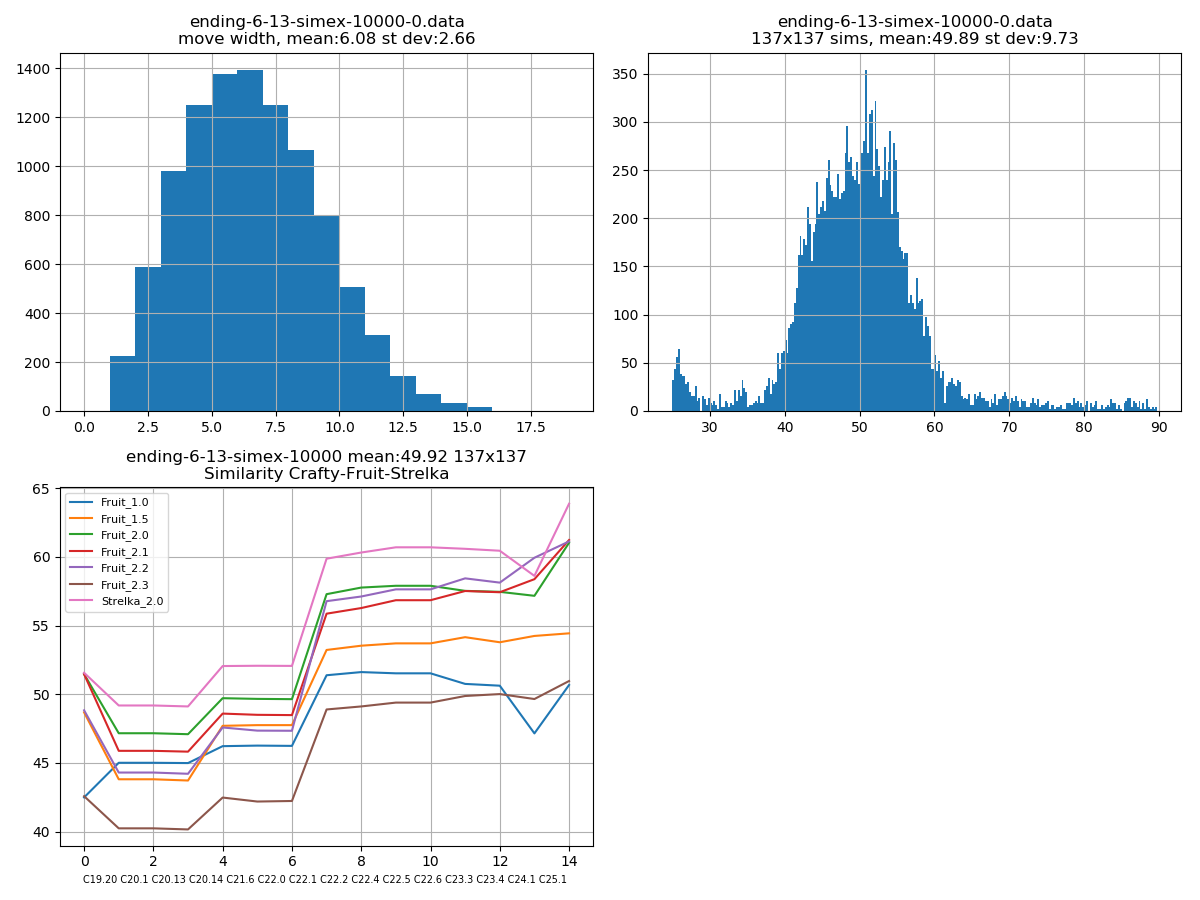

Notes
- early-middle-20-25 refers to game stage and range of count of pieces.
- 137x137 is the count of engines tested.
- 10000 or 40000 refers to the count of EPDs.
- mean on the plot graphs refers to the mean of all engine similarities for that game phase.
- mean and standard deviations are shown on the histograms.
- mean engine similarity is higher than is would be for a sample of totally independent engines, for the reason that there are many similar engines in the list of engines by virtue several being part of a development series. The Sim distribution histograms have a fat tail at the upper end.